New York City vehicle collision analysis
Worst location, weather and location-clustering
In New York City, more than 200,000 motor vehicle collisions happen every year.
This means about every 3min, a collision happens somewhere in NYC. To reduce collisions, we need to discover the key factors to improve.
I used NYC collision data and historical weather data to identify the worst location (total number of collisions) and worst weather condition (frequency of collision). Further I developed new method to investigate locations where sensitive to certain weather condition.
Worst vehicle collision location in NYC
Thanks to NYC Open Data we can access to motor vehicle collision data which is provided by NYPD. This dataset contains detailed information about collisions including: Time, Date, Location, Contributing factor, Vehicle type and number of persons injured. Now this dataset included GPS coordinates of collision location. I checked worst collision location (total number of collisions) in NYC using 595,669 collision data from July 2012 to May 2015.(data of before July 2012 is not available)
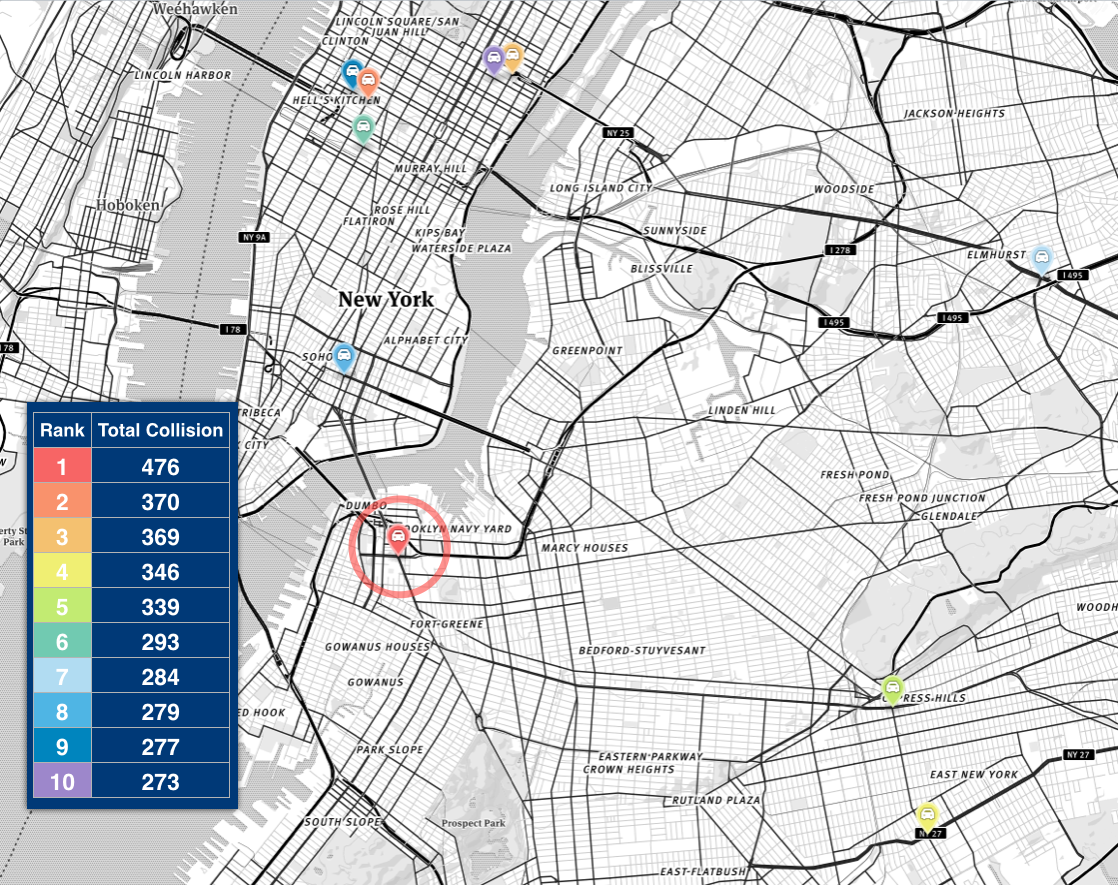
So where would you say the worst location in NYC?
Interestingly, it's in Brooklyn. Not in Manhattan. This red pointer indicates the worst locations. Check the ranking of the total number of collisions on the left blue box. This place had 476 collisions in last three years. When you check 2nd and 3rd ranking, you can see this place is exceptional.
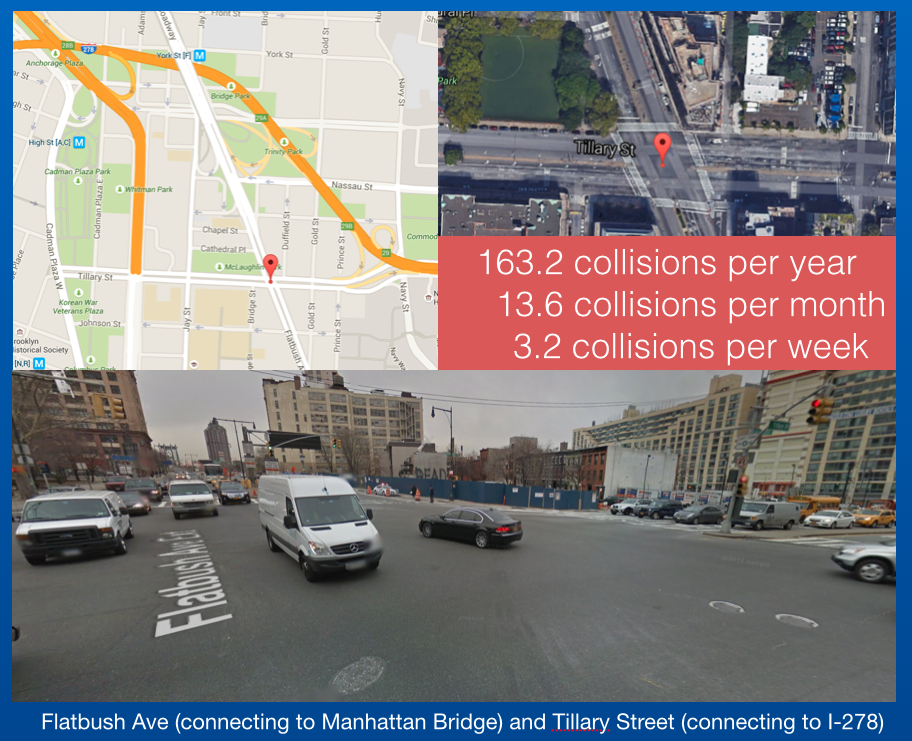
Here are the pictures of the worst location. The address is the intersection of Flatbush Ave and Tillary Street. There must be a reason or two for this intersection to be so dangerous, and it needs improvement ASAP.
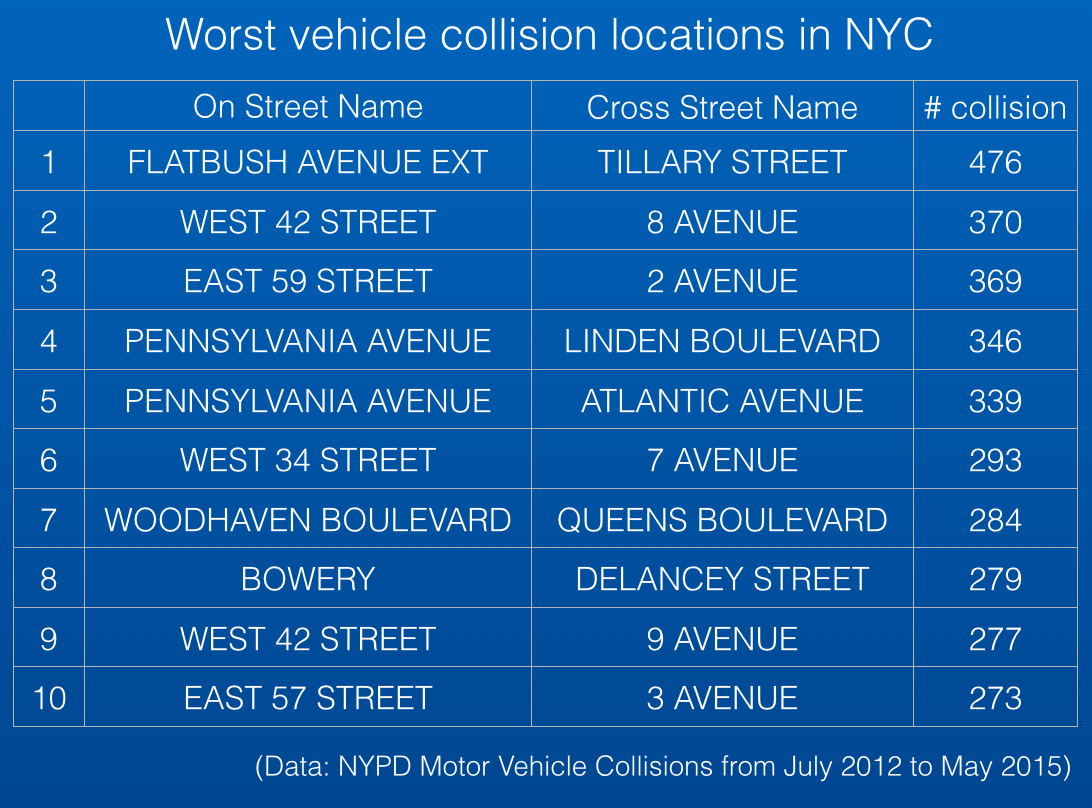
Worst 10 vehicle collision locations in NYC
This table shows street names of worst 10 collision locations. Some of intersections you may easily imagine high number of collision.
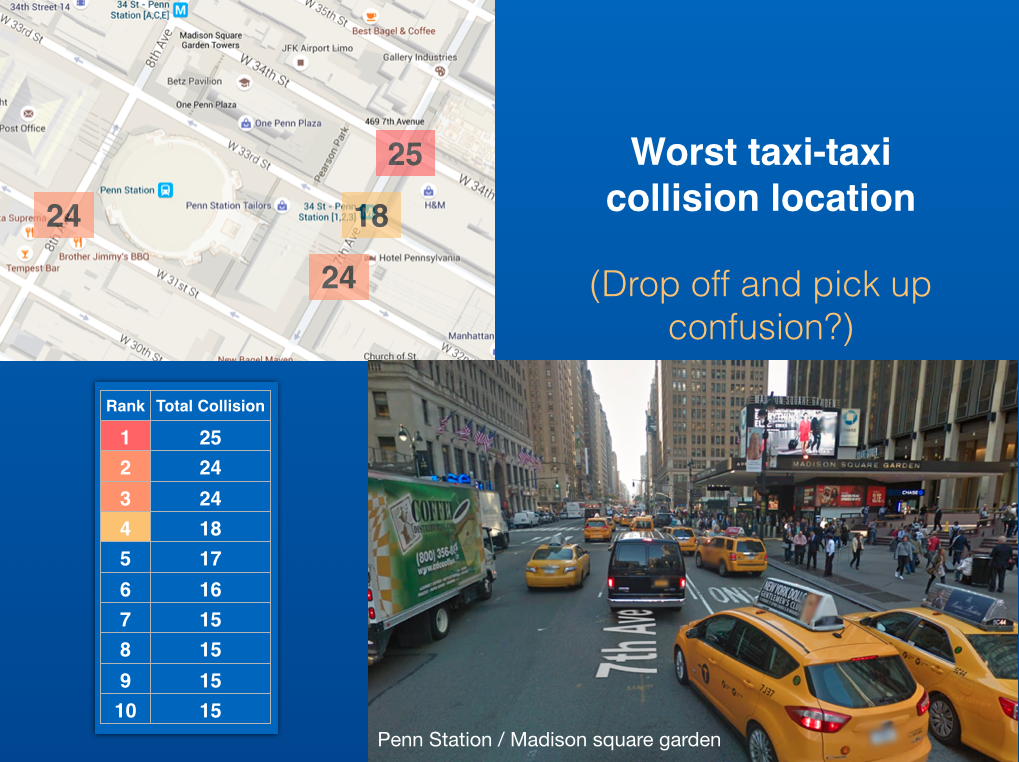
Worst taxi-taxi collision locations in NYC
In this NYC collision data, we can easily identify various worst locations other than total number of vehicle collision. For example number of people injured, number of pedestrians injured and specific vehicle type collision. Among that, here I will show one interesting example. “The worst taxi-taxi collision locations.” That is Penn Station/ Madison Square Garden. This location has huge human and taxi traffic. In fact, these surrounding blocks hold all top 4 worst taxi-taxi collision locations. This doesn’t sound like coincident but has a very good reason to invite taxi collisions. If you look carefully, the taxi pick-up and drop-off places are mixed in this location. My guess is that making clear separation between pick-up and drop-off would improve number of collisions in this busy location.
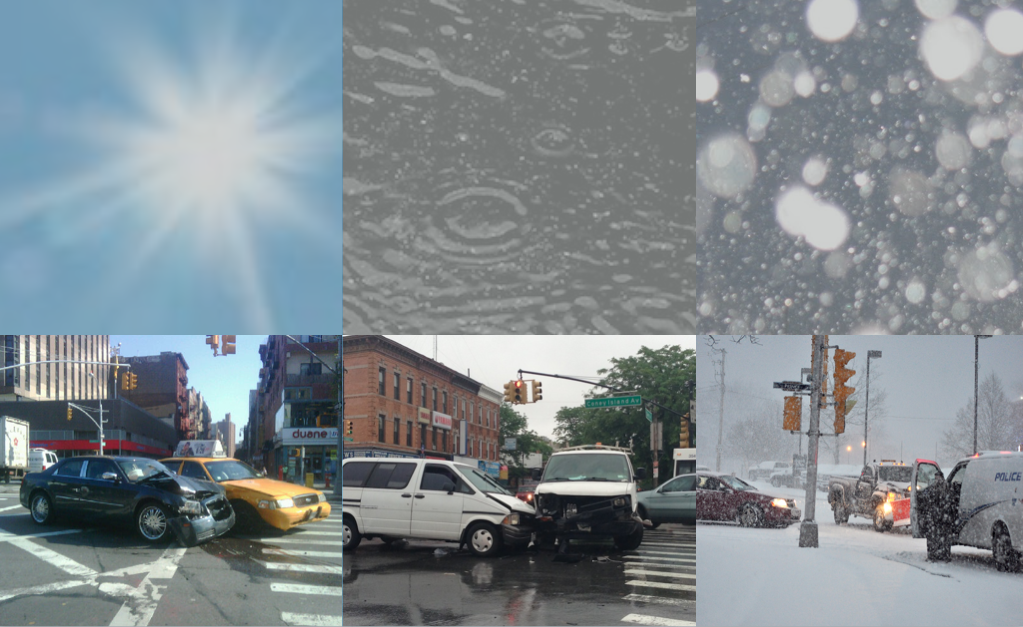
What weather conditions have the worst collision rate in NYC?
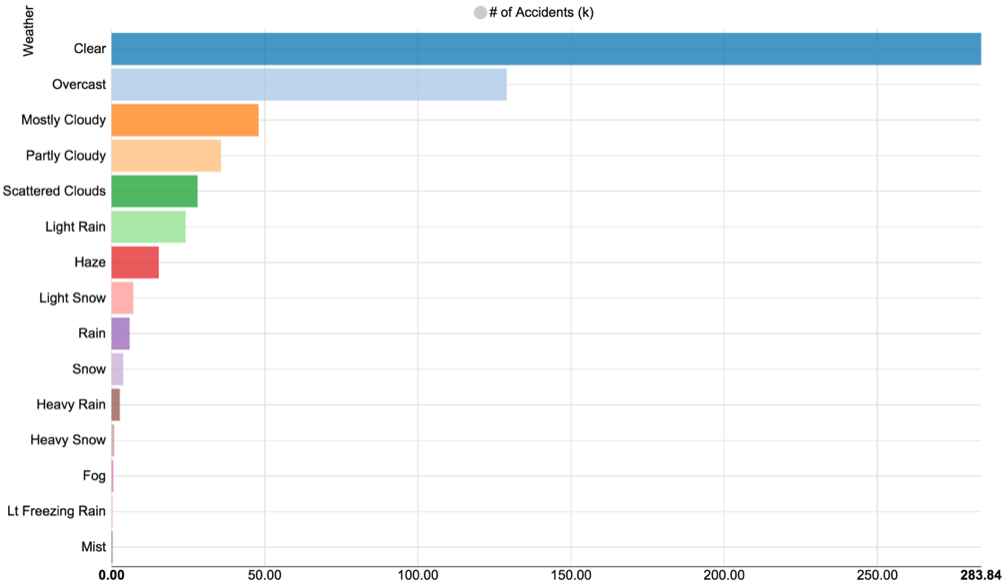
Next I checked frequency of collision in certain weather conditions. Vehicle collision data was joined with hourly NYC weather data by searching closest time point prior to each collision. Data are from weather underground. First I checked total number of collision grouped by weather conditions.
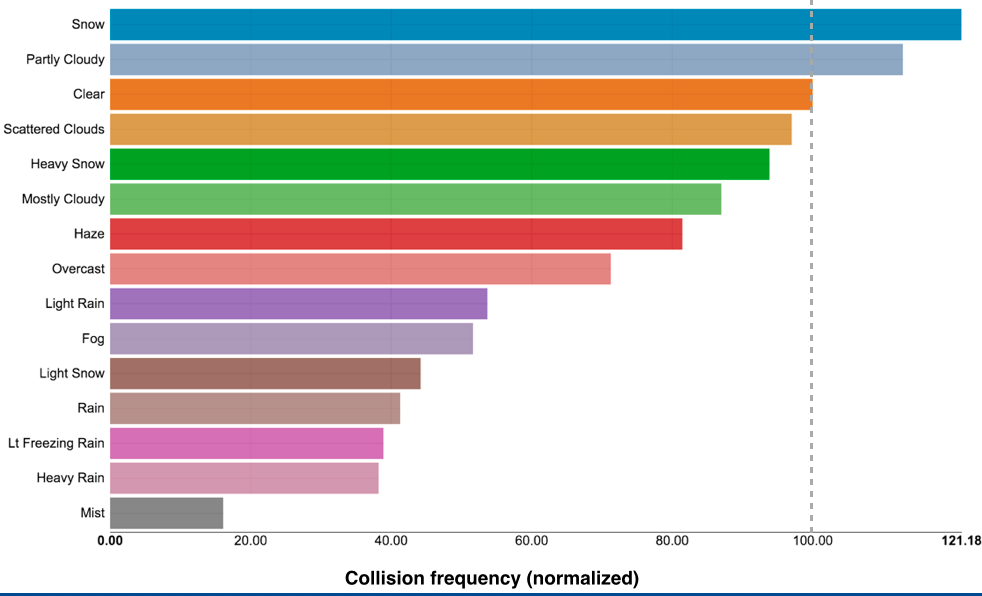
Using same time period (2012-2015) weather condition data I calculated frequency of collision (# of collision per hour of specific weather condition) and normalized with clear weather (as 100%). Snow shows the highest collision frequency. Interestingly rain is much lower than clear condition. This may come from this collision data is about all NYC area and not about high-speed highway.
Location clustering with collision + weather
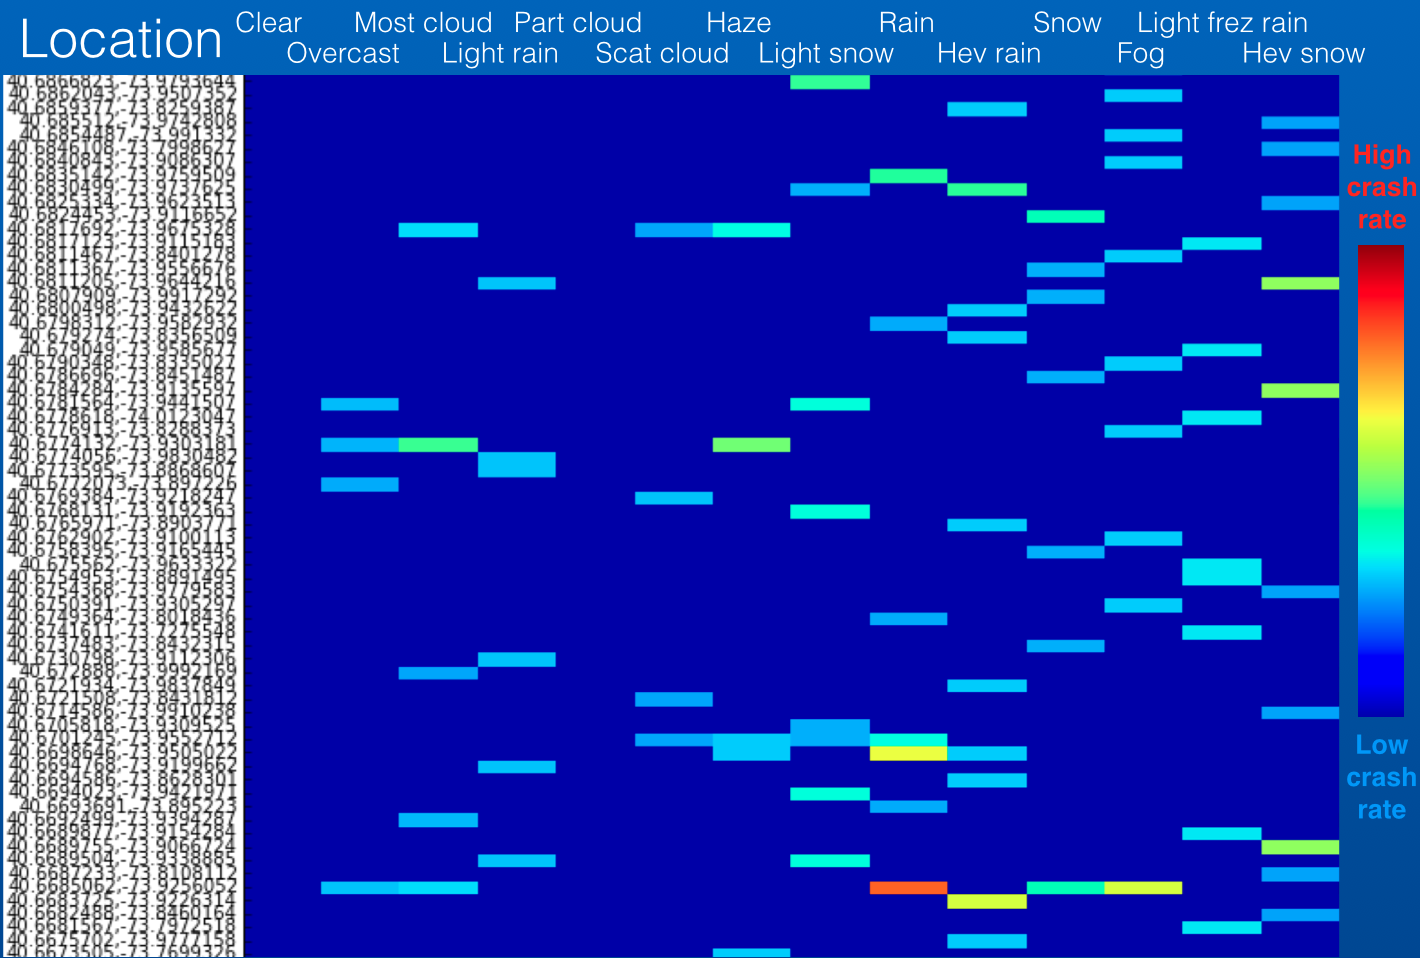
Lastly I want to share new tool, which I developed, to characterize collision locations. This analysis tool aim to identify locations where are sensitive to specific weather condition(s). If we find specific cluster of locations, these locations would have shared defect which lead to vehicle collision in certain weather conditions. This would give us new insights about high frequency collision locations.
I made a matrix for clustering analysis. Each row represents unique collision location. Columns represent weather conditions. Value (color bar in the figure) is frequency of collision in that weather condition. For example, the top row location hold high rate of collision specifically in light snow. I applied machine learning algorithms to cluster these locations.
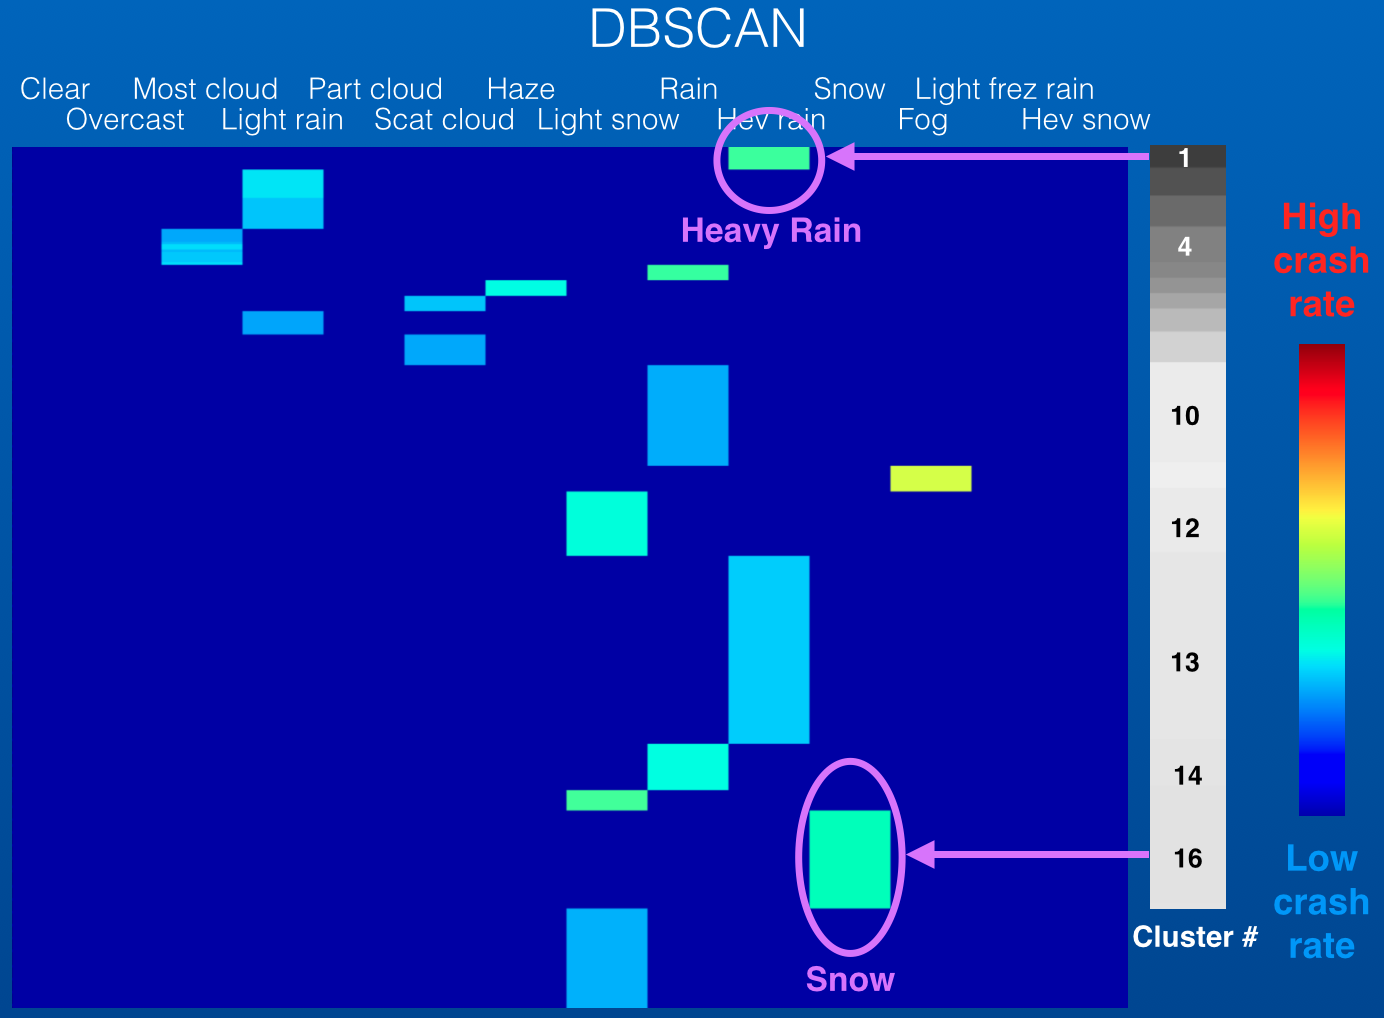
Here are the results. Each algorithm uses different method to cluster, but all depending on point distance. There are many interesting clusters, but for now let’s focus on these two clusters.
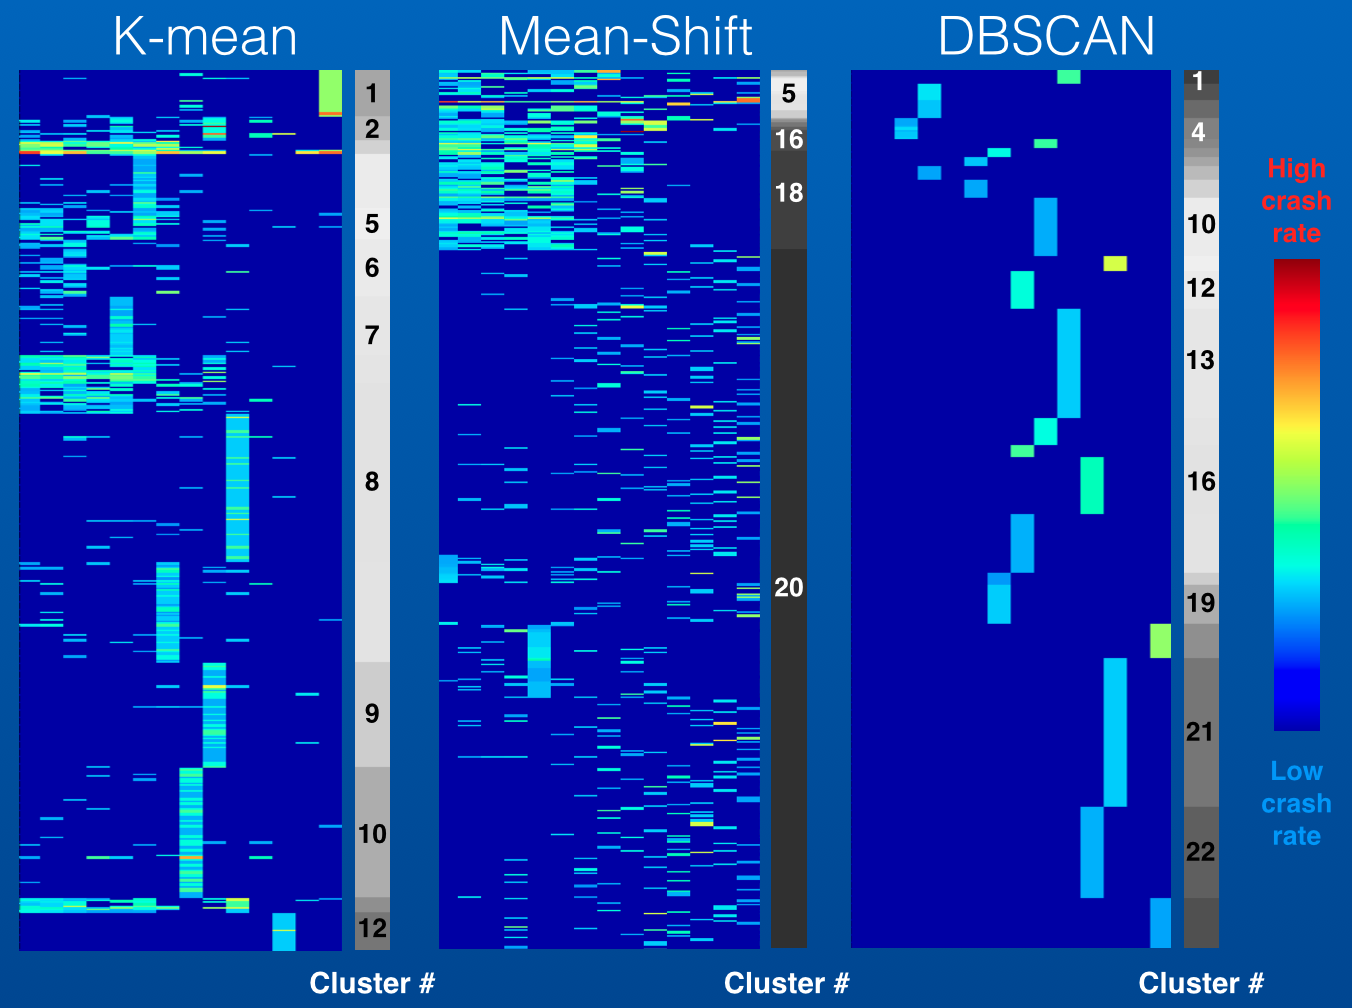
These cluster #1 and #16 locations from DBSCAN had accidents only in Heavy rain or Snow. Let’s see these locations.
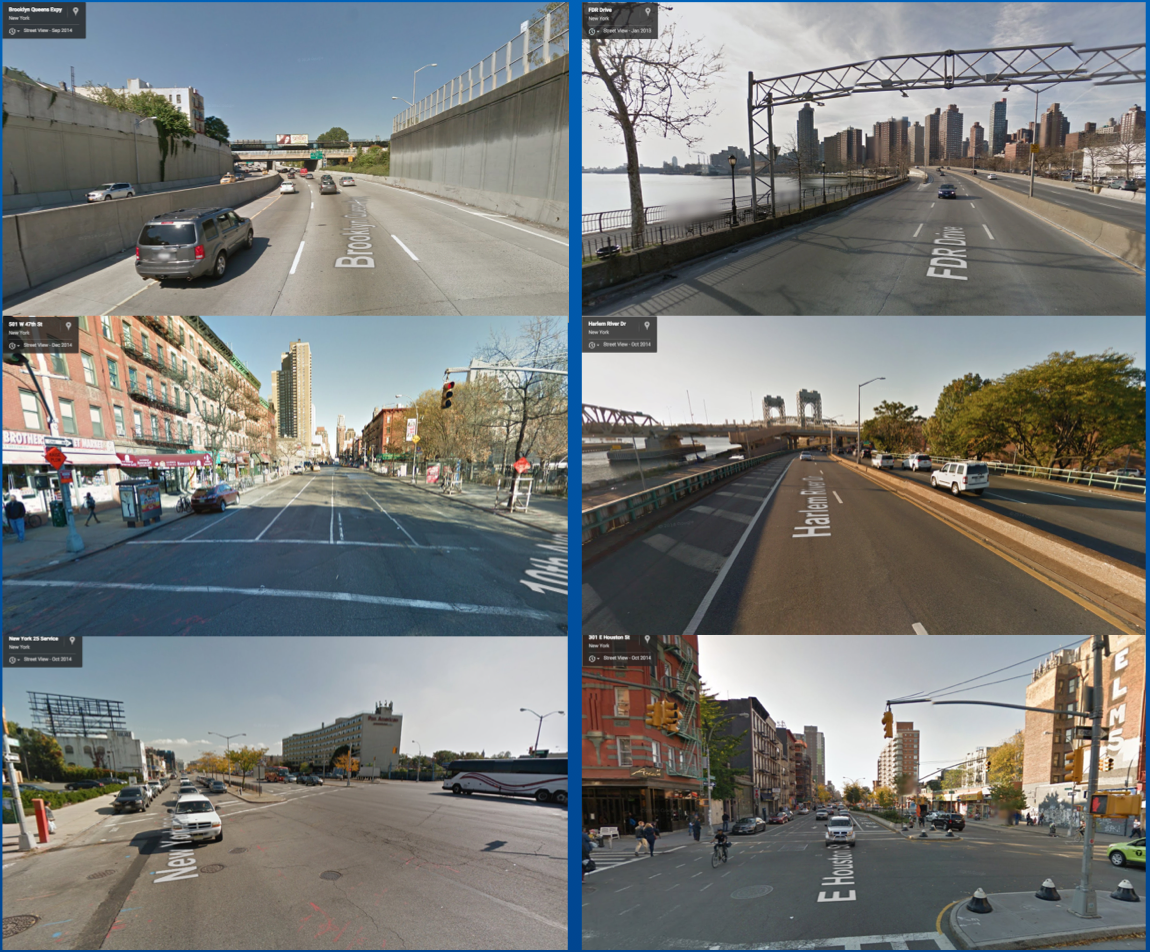
Locations sensitive to Heavy rain
Here is the heavy rain cluster. These locations are multi-lane road, and my guess is higher average driving speed. This result suggests that the collision frequency in Rain must is much higher if the collision data shows only highway (with multi-lane roads and in high speed) instead of whole NYC. How about snow sensitive locations?
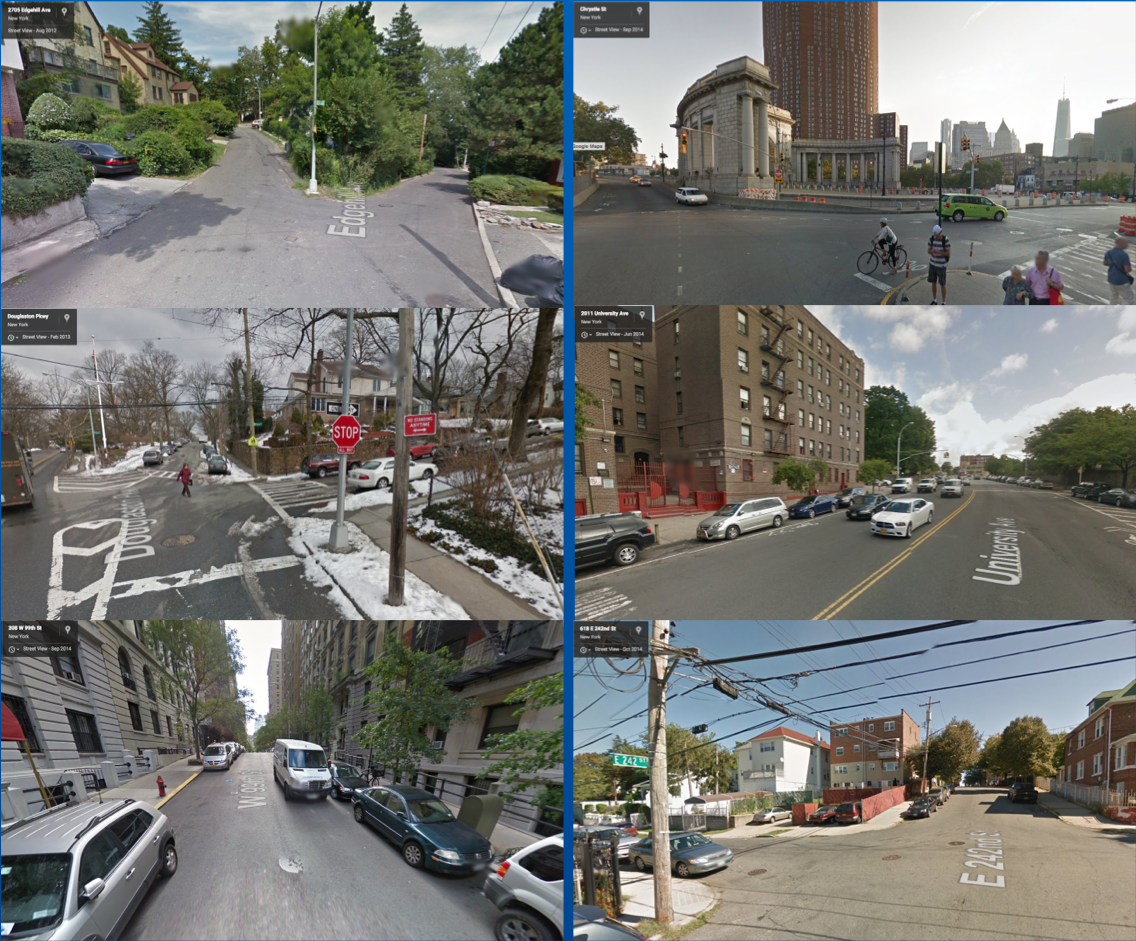
Locations sensitive to Snow
About half of snow sensitive clusters were sloping roads. You can easily imagine vehicle slides and crash into other car during snow. As seen in these two heavy rain and snow example, this clustering method can help identify common features of weather sensitive locations. At least this method is useful to find high risk locations to conduct further research about environmental/location factor of vehicle collision.
Summary
- Worst location: Flatbush Ave and Tillary Street
- Worst weather: Snow especially on sloping roads
- Location clustering by weather-collision data is a new method to explore collision environments