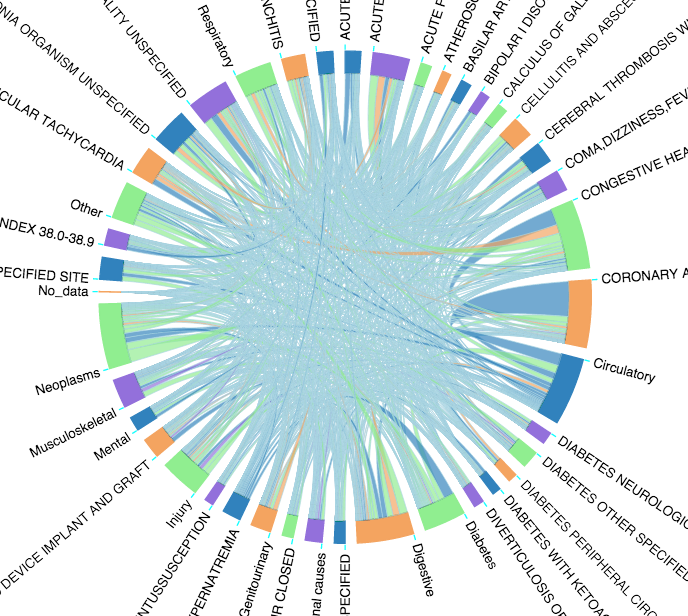
Connection between primary and secondary diagnosis
101,766 patients diagnosis data was visualized using d3.js.
Some primary diagnosis have more number of patients have particular secondary diagnosis (e.g. hyperosmorarity), on the other hand some have very wide spread sencondary diagnosis (e.g. cerebral thrombosis). Each strings represent number of patients, so thicker bundle means more patients had that particular combination of primary and secondary diagnosis. Move your pointer over single primary diagnosis on the circle, it will highlight connection to the secondary diagnosis. More purple color means more number of patients.
Interactive d3.js plot of primary and seccondary diagnosis connection